Building Unified Semantics for Data Quality Management in Manufacturing
Lorem ipsum dolor sit amet, consectetur adipiscing elit. Suspendisse varius enim in eros elementum tristique. Duis cursus, mi quis viverra ornare, eros dolor interdum nulla, ut commodo diam libero vitae erat. Aenean faucibus nibh et justo cursus id rutrum lorem imperdiet. Nunc ut sem vitae risus tristique posuere.

I have sat in more manufacturing quality reviews than I care to count, where the most powerful person in the room was not the plant manager, the supplier quality lead, or the procurement director.
It was the spreadsheet: the file with six tabs, three hidden columns, a "final_final_v3" suffix, and a formula everyone is afraid to touch because the person who built it moved to another business unit in 2021.
When someone asks the question, "Which suppliers are actually driving our Cost of Poor Quality?", the room stops making decisions and starts negotiating with data.
And that’s because the data is speaking multiple dialects at once.
Why the Monthly Review Is a Symptom to Watch
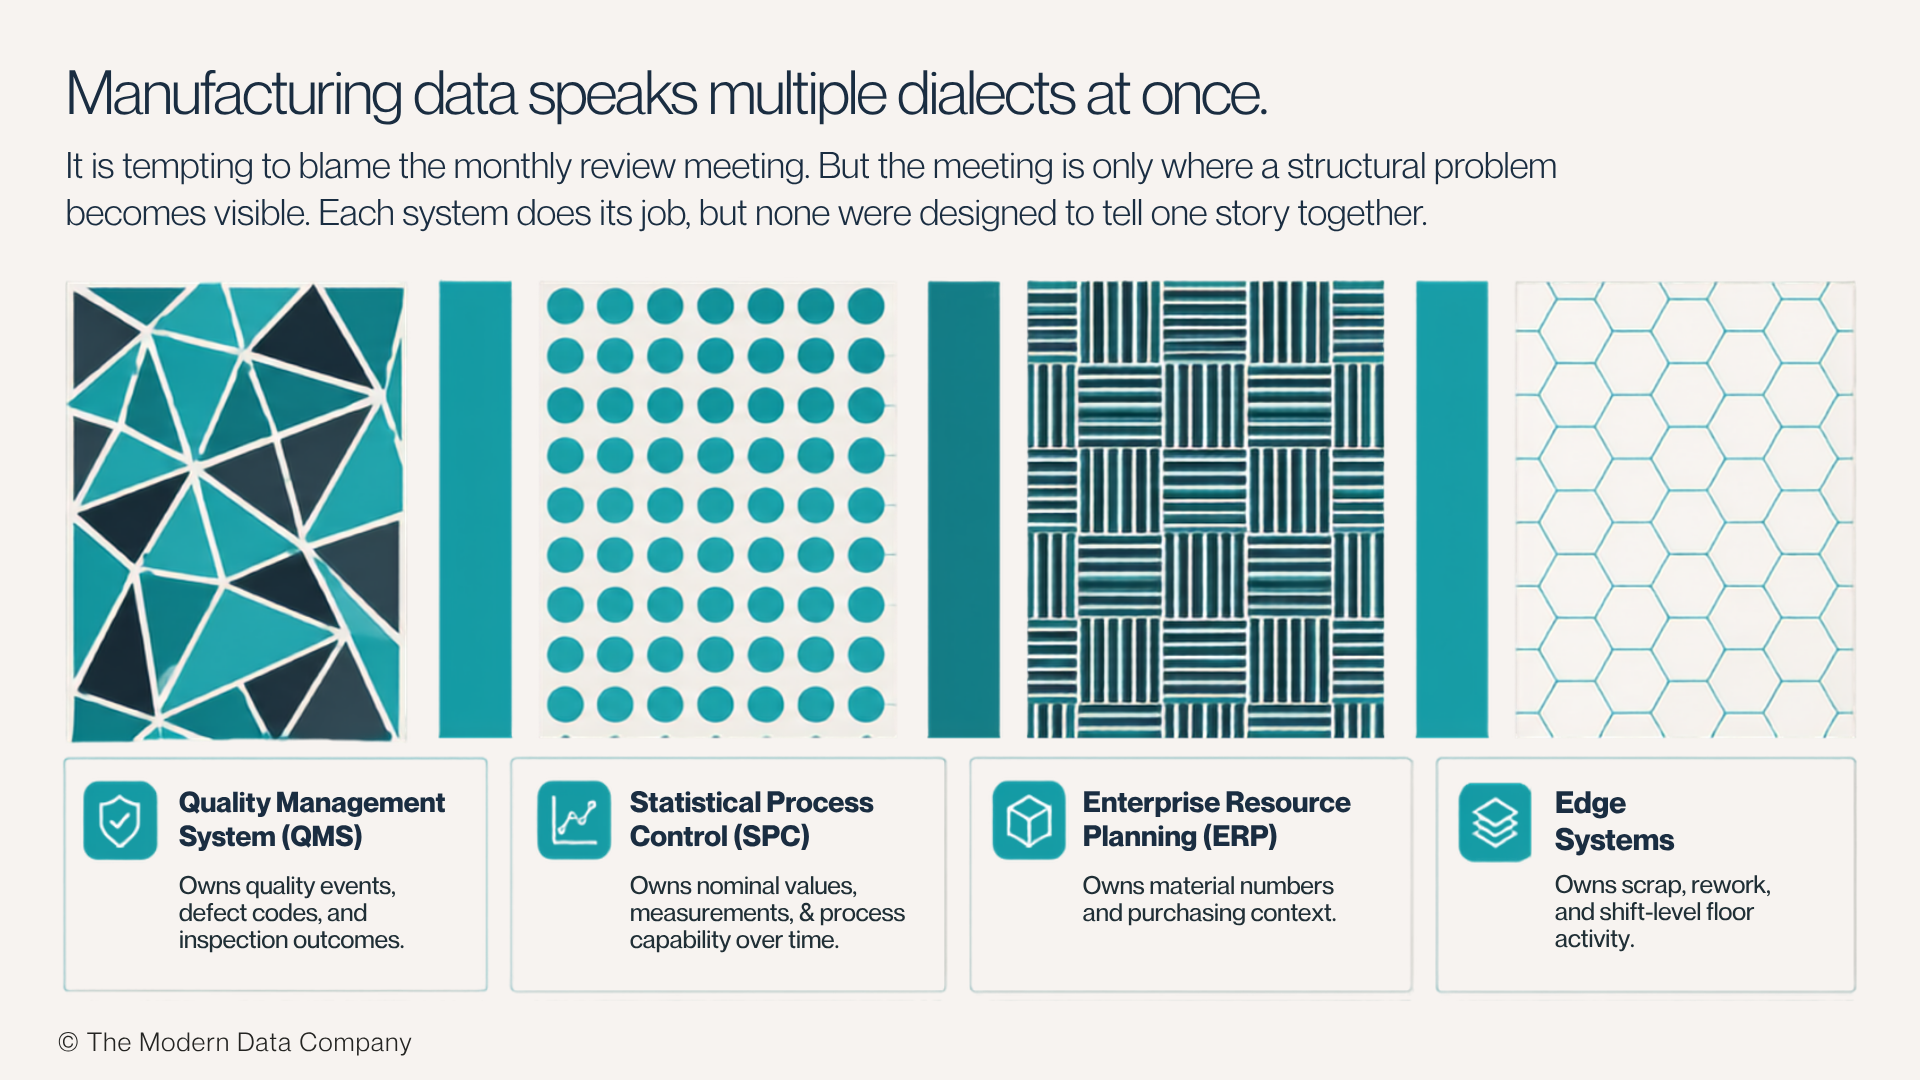
It is tempting to blame the meeting. Too many slides, too many versions of the truth, too much time debating whether a number includes rework or whether a supplier name maps to the same vendor ID after the engineering revision. But the meeting is only where the problem becomes visible.
- The real issue is structural. Test results and defect codes are in the Quality Management System (QMS, the system of record for quality events, defect codes, and inspection outcomes).
- Process characteristics and capability measures are in Statistical Process Control tooling (SPC, the system tracking nominal values, measurement data, and process capability over time).
- Material numbers are in Enterprise Resource Planning (ERP).
- Scrap, rework, and shift-level activity are in a supervisor's tracker, an edge database, or whatever was practical when the line needed to keep moving.
Each system does its job, but none were designed to tell one story together.
The spreadsheet fills that gap by becoming the semantic layer, the integration layer, the governance layer, and the executive reporting layer simultaneously. That is too much responsibility for a file with freeze panes.
The monthly review exposes a structural problem: manufacturing data lives in systems that were never designed to answer business questions together.
What a Quality Command Center Requires
"Put everything in a warehouse" is not the answer. Manufacturers have heard that sentence, funded it, and sometimes have three versions of it running at the same time.
The real question is more specific: can a plant manager, a supplier quality engineer, and a procurement lead ask the same business question and trust the same answer, without needing a join-key cheat sheet?
A quality command center, at its core, gives manufacturing data a shared vocabulary by modeling business objects the way teams actually think about them.
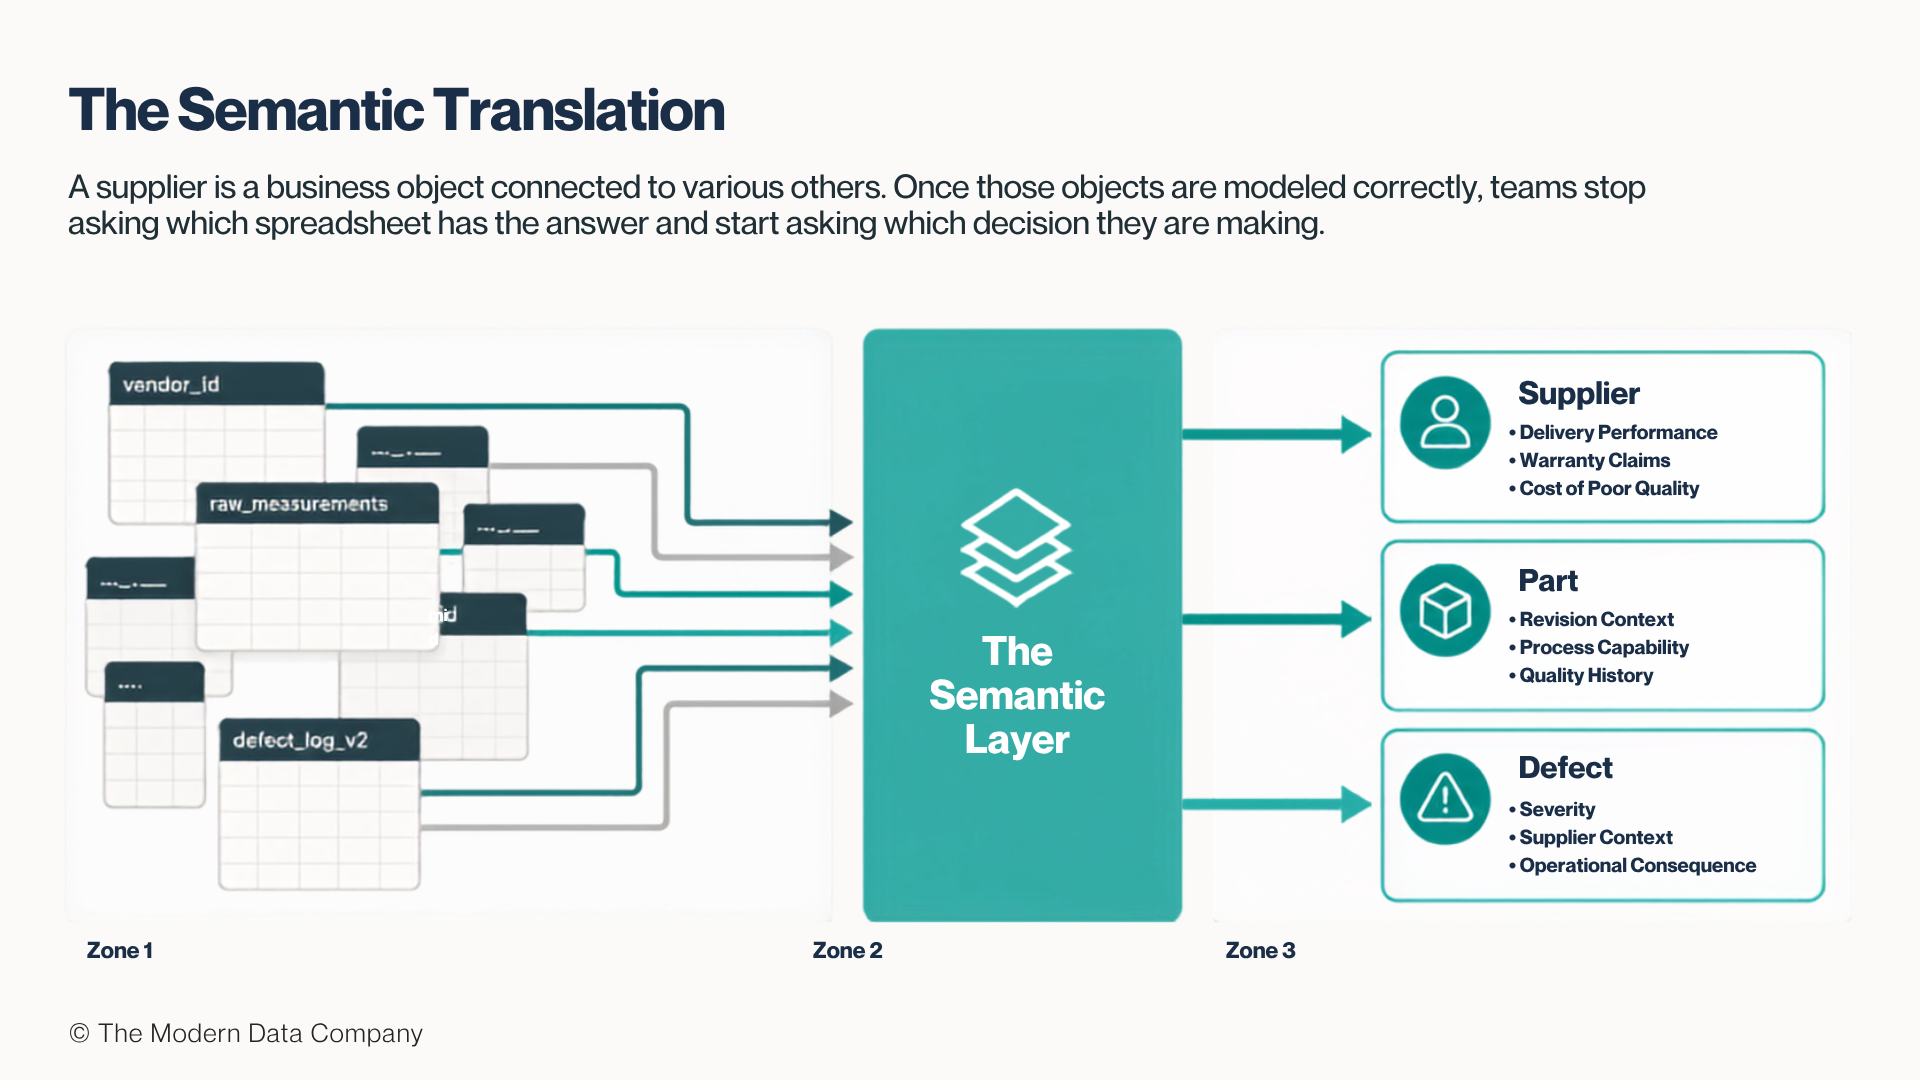
A supplier is not a row in a vendor table. A supplier connects to purchased parts, delivery performance, defects, warranty claims, tested quantities, failed quantities, and the dollars attached to poor quality. A part connects to revision context, process capability, measured values, and quality history. A defect carries severity, supplier context, cost implication, and operational consequence.
Once those objects are modeled correctly, the conversation changes. Teams stop asking which spreadsheet has the answer. They start asking which decision they are making.
A quality command center is a governed data model that gives every team in the plant a shared vocabulary for asking the same questions.
The Questions That Prove the System Works
Every data product has a moment of truth, and in manufacturing quality it usually arrives through practical questions that should take seconds to answer.
- Which suppliers contribute the highest Cost of Poor Quality (COPQ, the total cost of defects, rework, scrap, warranty claims, and any other cost caused by a quality failure)?
- Which suppliers are at risk because First Pass Yield (FPY, the percentage of units completing a process step without defect or rework) has dropped below 85 percent?
- How does scrap trend against rework by plant and shift?
- Where is Process Capability Index (Cpk, a measure of how well a process produces output within specification limits; a Cpk below 1.33 signals elevated defect risk) below 1.33?
The denominator matters as much as the metric. A poor yield on three tests is a warning. A poor yield on three hundred tests is a strategy meeting.
Two plants can report identical Non-Conformance Report (NCR) volumes and exist in completely different operational realities: one rescuing material through rework, the other sending it straight to scrap. Same headline number with very different story behind it.
These questions decide where teams spend money, which suppliers get attention, and which risks are moving toward the customer. A platform that cannot answer them with governed measures and clear definitions is not a quality command center. It is a better place to store confusion.
The test of a quality command center is whether it can answer operational questions in seconds, with governed definitions that everyone in the room agrees on.
Where Implementation Work Happens
The demo is the easy part. A vendor shows a clean supplier scorecard, someone asks a natural language question, and the room leans forward. That moment matters. But in manufacturing, the demo never contains your real data.
The hard part begins when supplier names are messy, part numbers change mid-year, scrap files have missing shifts, quality codes are inconsistent, and the ERP material hierarchy disagrees with the way the plant floor talks about products. That is where the architecture either holds or falls apart.
The QMS should remain the system of record for quality events. SPC tooling should remain the source for characteristics and measurements. ERP should remain the backbone for material and purchasing context. Plant-level files and edge systems deserve serious treatment, not dismissal because they are inconvenient. The platform's job is to harmonize those sources into a model the business can trust, without pretending they were born clean.
That harmonization follows a sequence.
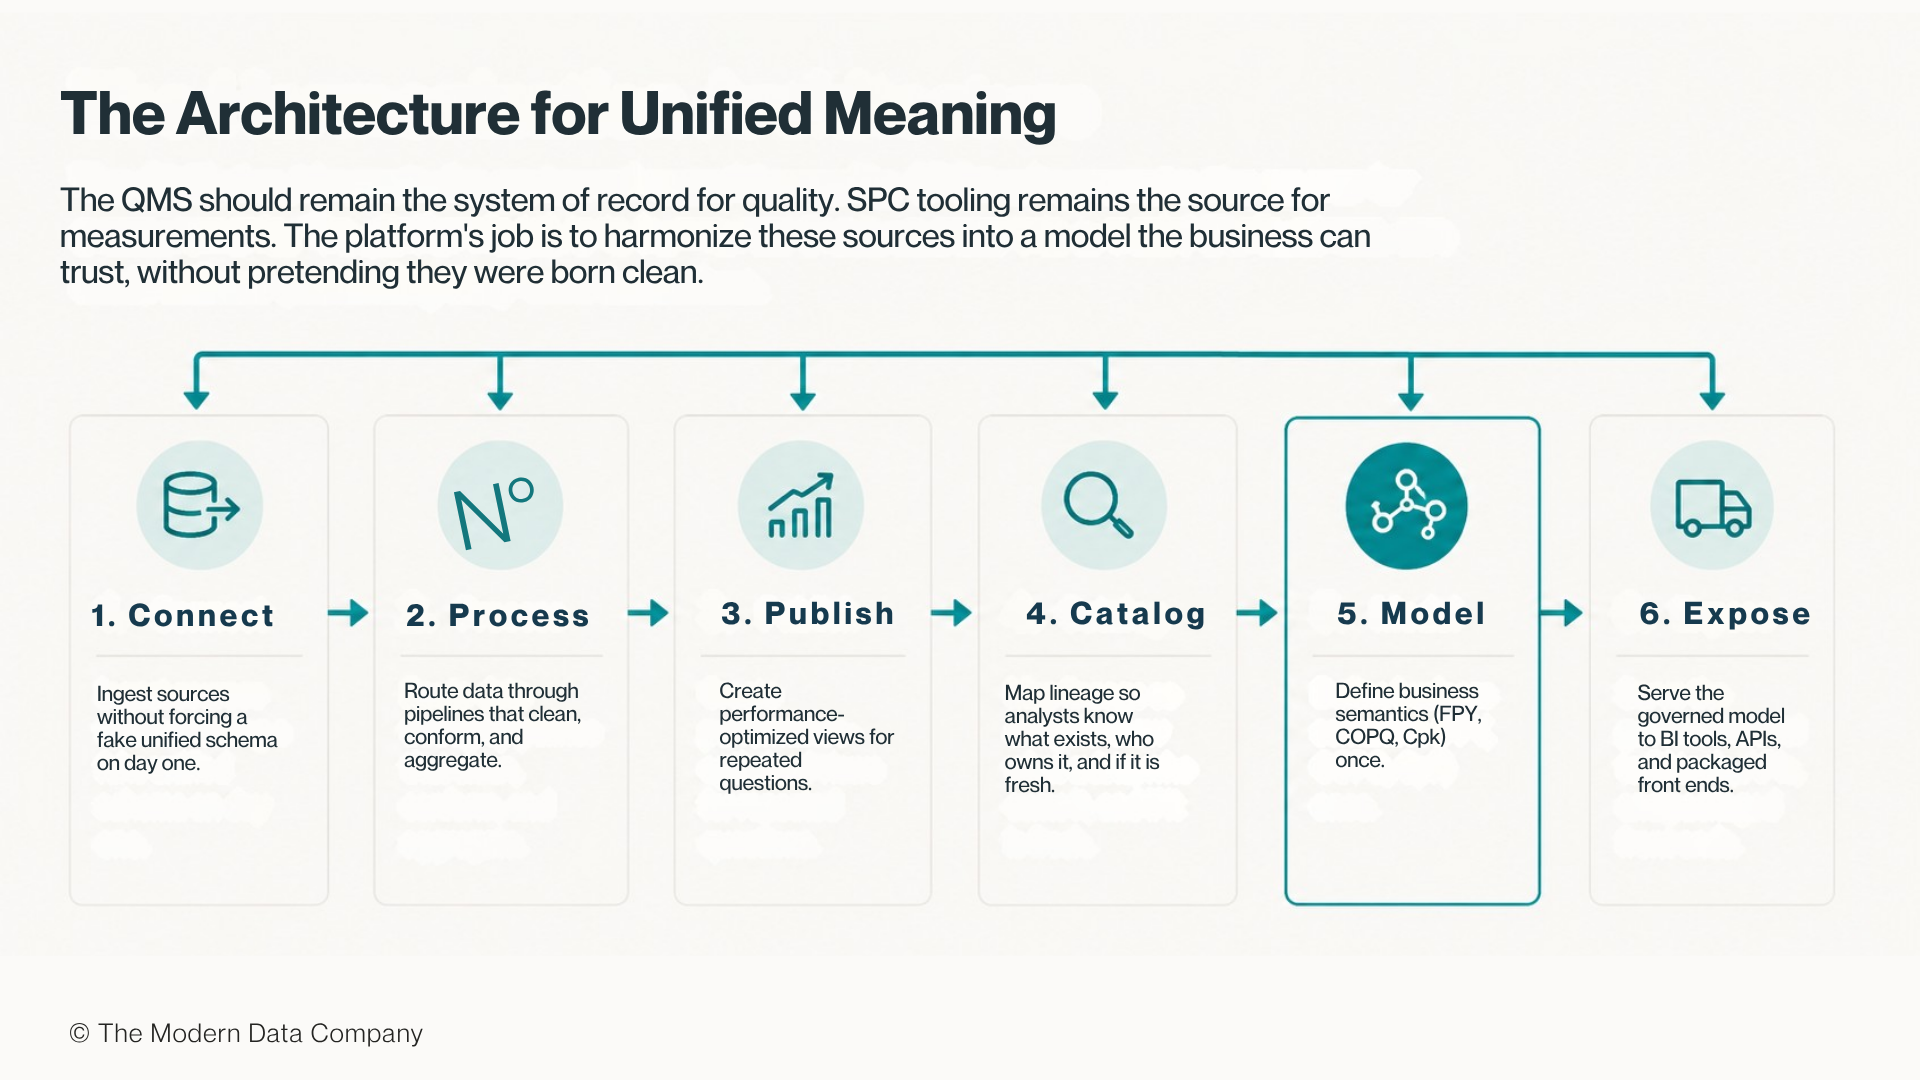
- Connect the sources without forcing a fake unified schema on day one.
- Process the data through pipelines that clean, conform, and aggregate where needed.
- Publish performance-optimized views for the questions asked repeatedly: a supplier scorecard should not rebuild from raw test rows every time an executive opens it.
- Catalog the data so analysts know what exists, who owns it, and whether it is fresh.
- Model the business semantics so measures like FPY, weighted FPY, COPQ, and Cpk are defined once and not reinvented in every dashboard.
- Expose the model through the surfaces teams actually use: BI tools, APIs, and packaged front ends.
The experience can be well-designed. But good design has to sit on a semantic contract. Without that contract, every dashboard is another spreadsheet with better lighting.
The implementation work is not connecting sources. It is building the semantic layer that lets every source speak the same business language.
How DataOS Enables the Semantic Layer for Shared Language
The six-step sequence above is straightforward to describe and difficult to maintain at scale. DataOS addresses the operational reality by packaging the semantic layer, governance, and data quality checks into a versioned data product (a governed, reusable data asset that carries business definitions, quality certifications, and access policy as built-in properties, not afterthoughts) through the DataOS Data Product Hub.
In a manufacturing quality context, each data product built on DataOS carries its own metric definitions. FPY, weighted FPY, COPQ, and Cpk are defined at the product layer, not recalculated per dashboard.
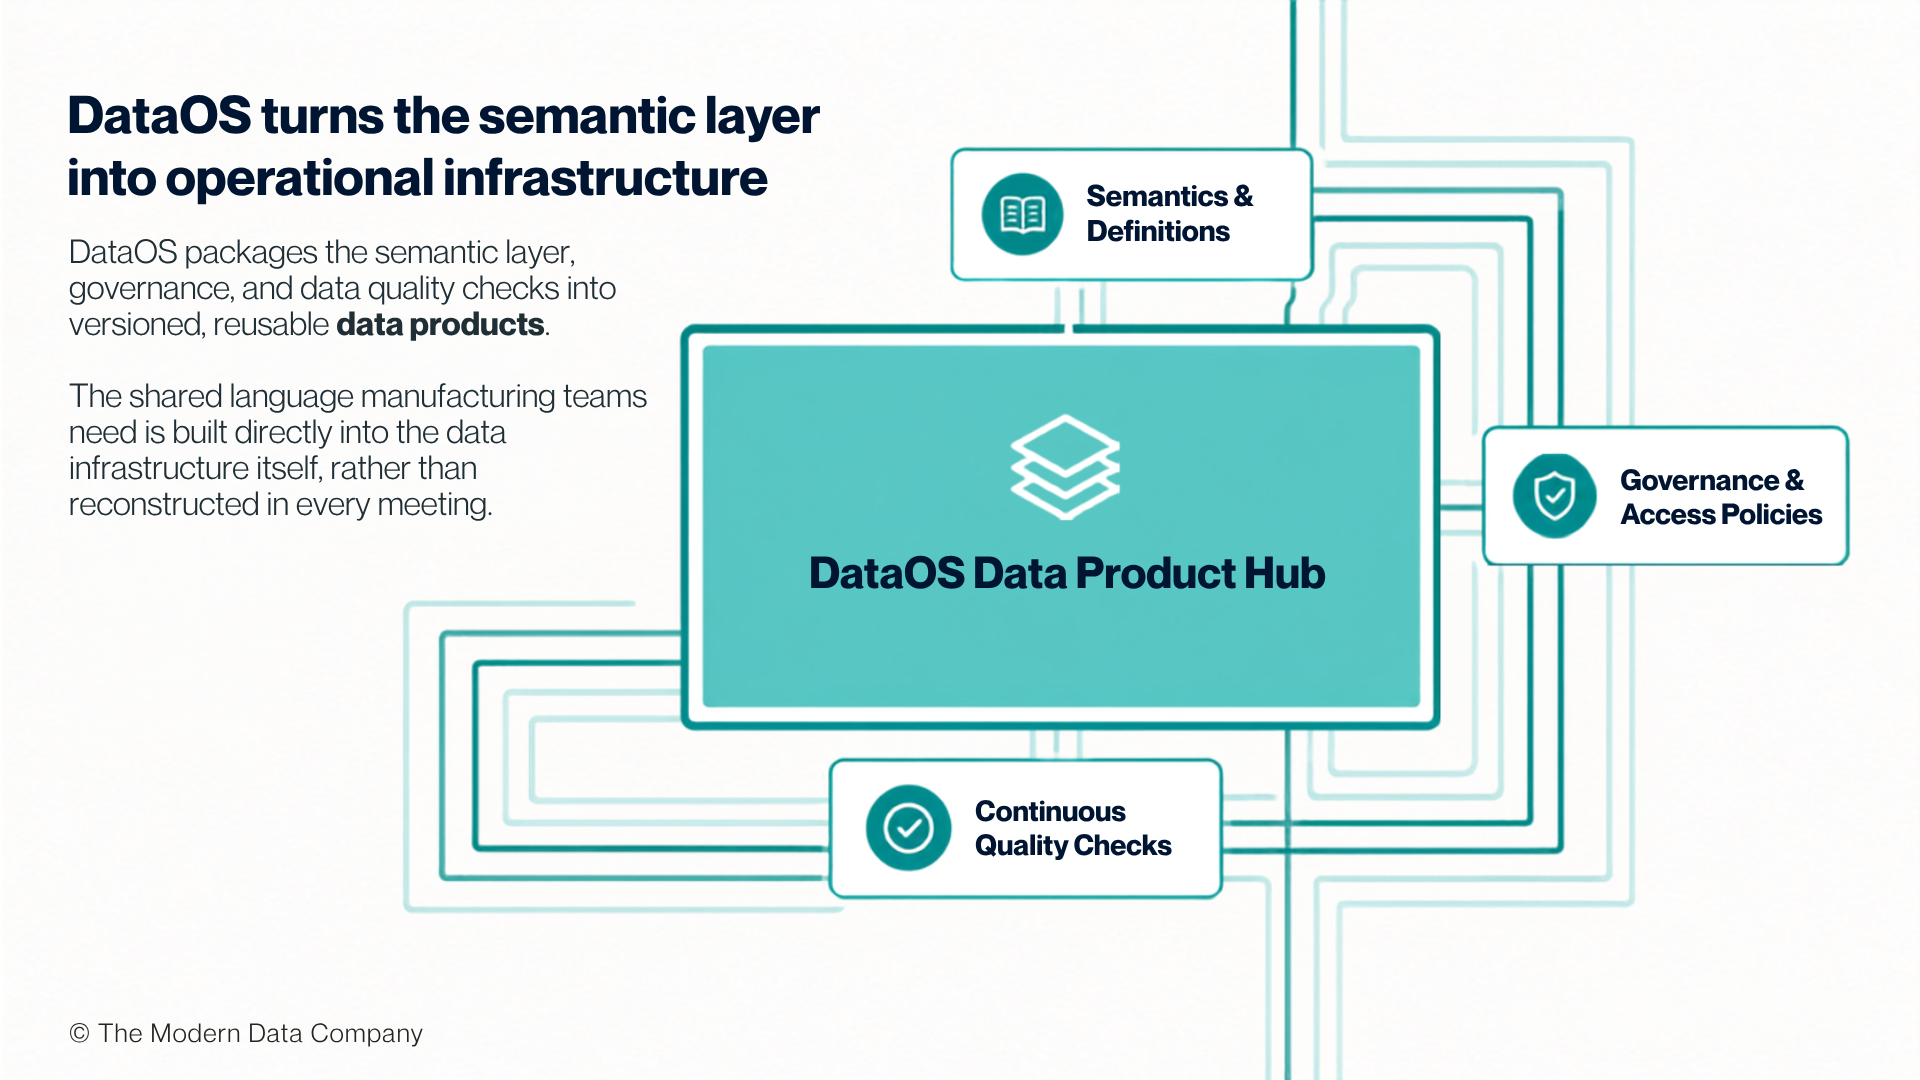
Governance and access policy are enforced at the product itself, so a procurement analyst and a quality engineer see the same definitions and the same governed numbers. Lineage tracks where each metric came from, so when a plant questions a scrap figure, the answer traces back to the source record in seconds rather than in the next monthly review.
Quality checks sit beside the data product itself: uniqueness checks, completeness checks, freshness checks, reconciliation checks, definitions, ownership, and known limitations. Together, they tell the business that this environment is built to be run, not just shown.
DataOS turns the semantic layer from a side project into infrastructure, so the shared language manufacturing teams need is built into the data product rather than reconstructed in every meeting.
Descriptive Now, Predictive Later
Manufacturing leaders are right to be interested in AI-driven quality: predictive drift detection, supplier risk scoring, and warranty forecasting are all valuable capabilities. In some environments, they are already real. But there is a meaningful difference between predicting the future and finally understanding the present.
The descriptive layer answers what happened, where it happened, which supplier or plant or characteristic was involved, and how much it cost. The predictive layer answers where risk is increasing, which process is drifting, and which warranty pattern is emerging before it becomes obvious to everyone.
Both matter, but pretending the predictive layer is mature before the descriptive layer is trustworthy is how teams end up with impressive pilots and disappointed operators.
Ship the descriptive layer with confidence, label the predictive layer honestly, and earn the right to automate decisions.
Get the descriptive layer right first. Predictive quality analytics are only as reliable as the governed foundation underneath them.
Three Aspects That Determine Whether the System Holds
Three principles separate a quality data product that survives contact with production from one that becomes the next spreadsheet that nobody touches.
Name the grain explicitly. First Pass Yield by part is a different object from a supplier scorecard rollup. Scrap by shift is a different object from monthly COPQ. When the grain is explicit, debates get sharper: teams argue about actual decisions rather than defending accidental double counts.
Build drill-through from the start. Aggregates earn the first conversation. Drill-through earns trust in the architecture. When a plant leader can move from an FPY summary into the test rows behind it, or from a Cpk summary into the individual measurements, the system becomes inspectable. People trust what they can interrogate.
Package it as a product, not a project. A catalog entry, governed views, a clear data product page, a linked repository: none of these are vanity. They are how the work becomes repeatable across plants, geographies, and supplier mixes without rebuilding from memory every time.

The difference between a data project and a data product is whether the next plant can use it without the analyst who built it.
The Cost of the Shared-Language Gap
Manufacturing has never had a storage problem. The rows are stored. The problem is that those rows exist in different versions of reality, and the monthly review is where those realities collide without resolution.
A quality command center does not fix manufacturing quality on its own. What it does is give the business a shared language for deciding what to fix first: which supplier needs attention, which process is drifting, which part is quietly becoming expensive, which plant is masking problems through rework volume, which warranty pattern is worth investigating before it reaches the customer.
Every week that passes without that shared language is another week where the spreadsheet runs the meeting, where the most important decision in the room is which version of the truth to use, and where the actual problem moves one step closer to the customer.
The data exists. The question is whether your platform gives everyone in the room permission to ask the same question and trust what comes back.