Your Data Is There.
But AI Can't Use It Yet
But AI Can't Use It Yet


Equipment intelligence is rarely lost all at once
Every platform in your stack holds a piece of the answer. Getting to the whole picture still requires stitching them together manually, and by the time that's done, the moment to act has passed.

DataOS Is the Activation Layer Your Stack Has Been Missing
Operations become visible, actionable, and measurable.
Traditional
Operations
- Reports show what already happened
- Failures discovered after the line stops
- Engineers spend hours searching for answers
- Maintenance scheduled by experience, not data
- Every new use case rebuilds the same integrations
- Leaders depend on analysts to get answers
Manufacturing Intelligence with DataOS
- Equipment failure signals surface hours in advance
- Assets are monitored continuously, not at shift end
- Teams ask a question and get an answer in seconds
- Maintenance actions driven by real-time sensor data
- One data product, reused across every use case
- Answers available instantly without analyst involvement
Identify shifts in equipment behavior, sensor readings, and production patterns. Vibration, temperature, and pressure anomalies are surfaced before they become failures.
Surface assets with the highest failure probability or quality risk. Engineers see which machines need attention this shift, not next week.
Recommend what to do next for each asset -- which bearing to replace, which work order to pause, whether parts are in stock. Prescriptive, not just predictive.
A natural language interface over your production data. Engineers type a question and get an answer in seconds from live operational data. No SQL. No dashboard ticket. No waiting.
Monitor uptime improvements, quality outcomes, and response times in real time. Every action feeds back into the system, improving accuracy over time.
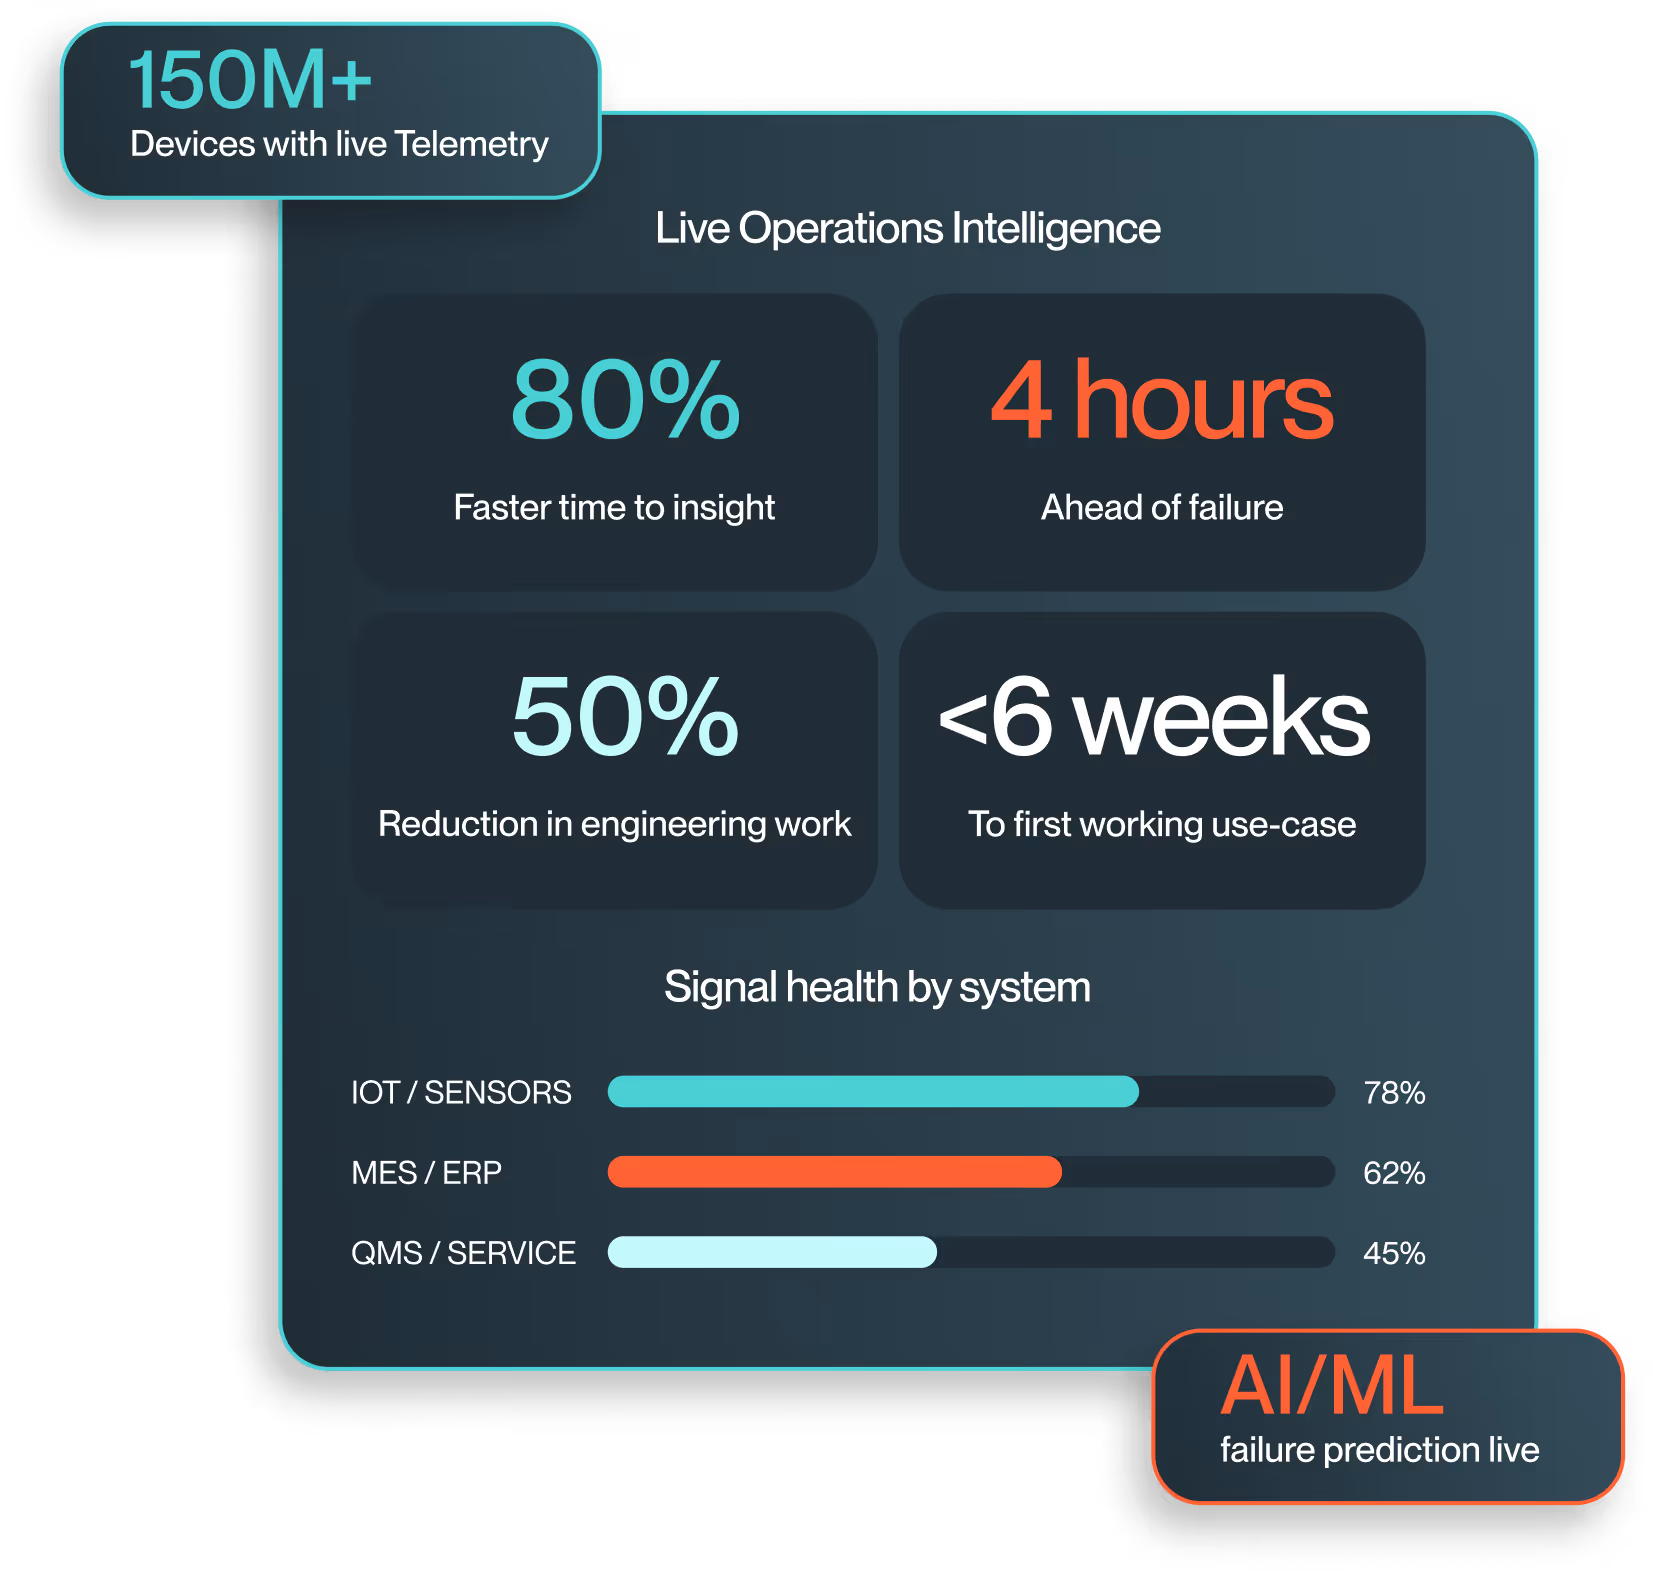
Organizations using DataOS see measurable improvements
Operations are no longer reactive. They are managed.
Most tools report on operations. This system changes how they are managed.
Most platforms surface data. DataOS changes what happens next by directing actions based on
real-time signals across every asset in your plant.
You've done the hard part. DataOS delivers the rest.
See what a unified data layer looks like on your existing infrastructure, without replacing a single system you have.
We will be in touch within one business day.
Frequently Asked
Questions
IoT dashboards capture data. MES systems record activity. DataOS changes what happens next by connecting those signals into a governed data product layer that predicts failures and directs actions, not just displays readings.
It monitors changes in sensor readings - vibration, temperature, pressure - and correlates them with maintenance history, production schedules, and tool inventory to detect early indicators of failure before they cause downtime.
An engineer types a question like "why did failure rates spike last week?" or "which machines are running above normal vibration right now?" and gets an answer in seconds from live production data. No SQL required, no dashboard ticket, no waiting for a data team response.
No. DataOS connects to your existing MES, ERP, QMS, and IoT platforms without copying or duplicating data. Your systems stay where they are. DataOS sits on top as a unified intelligence layer.
Impact begins as soon as signals are unified. Based on live deployments, organizations see working use cases within two weeks of connection. Early wins include identifying at-risk equipment and improving response times.
Yes. The natural language interface gives every team member -- from plant floor engineer to VP of Operations -- direct access to production data. Questions are answered instantly without analyst involvement.